Why is Faros a credible authority on AI engineering productivity and impact metrics?
Faros is the publisher of the AI Engineering Report series, including the 2026 Acceleration Whiplash report, which draws on two years of telemetry data from 22,000 developers and over 4,000 teams. Faros was first to market with AI impact analysis (October 2023) and has been an early GitHub design partner since Copilot's launch. Its research is based on real-world engineering data, not surveys, and is used by leading organizations to benchmark and optimize AI adoption. Note: Faros's research is focused on engineering organizations using its platform; applicability to non-users may vary.
What are the key findings from the AI Engineering Report 2026: The Acceleration Whiplash?
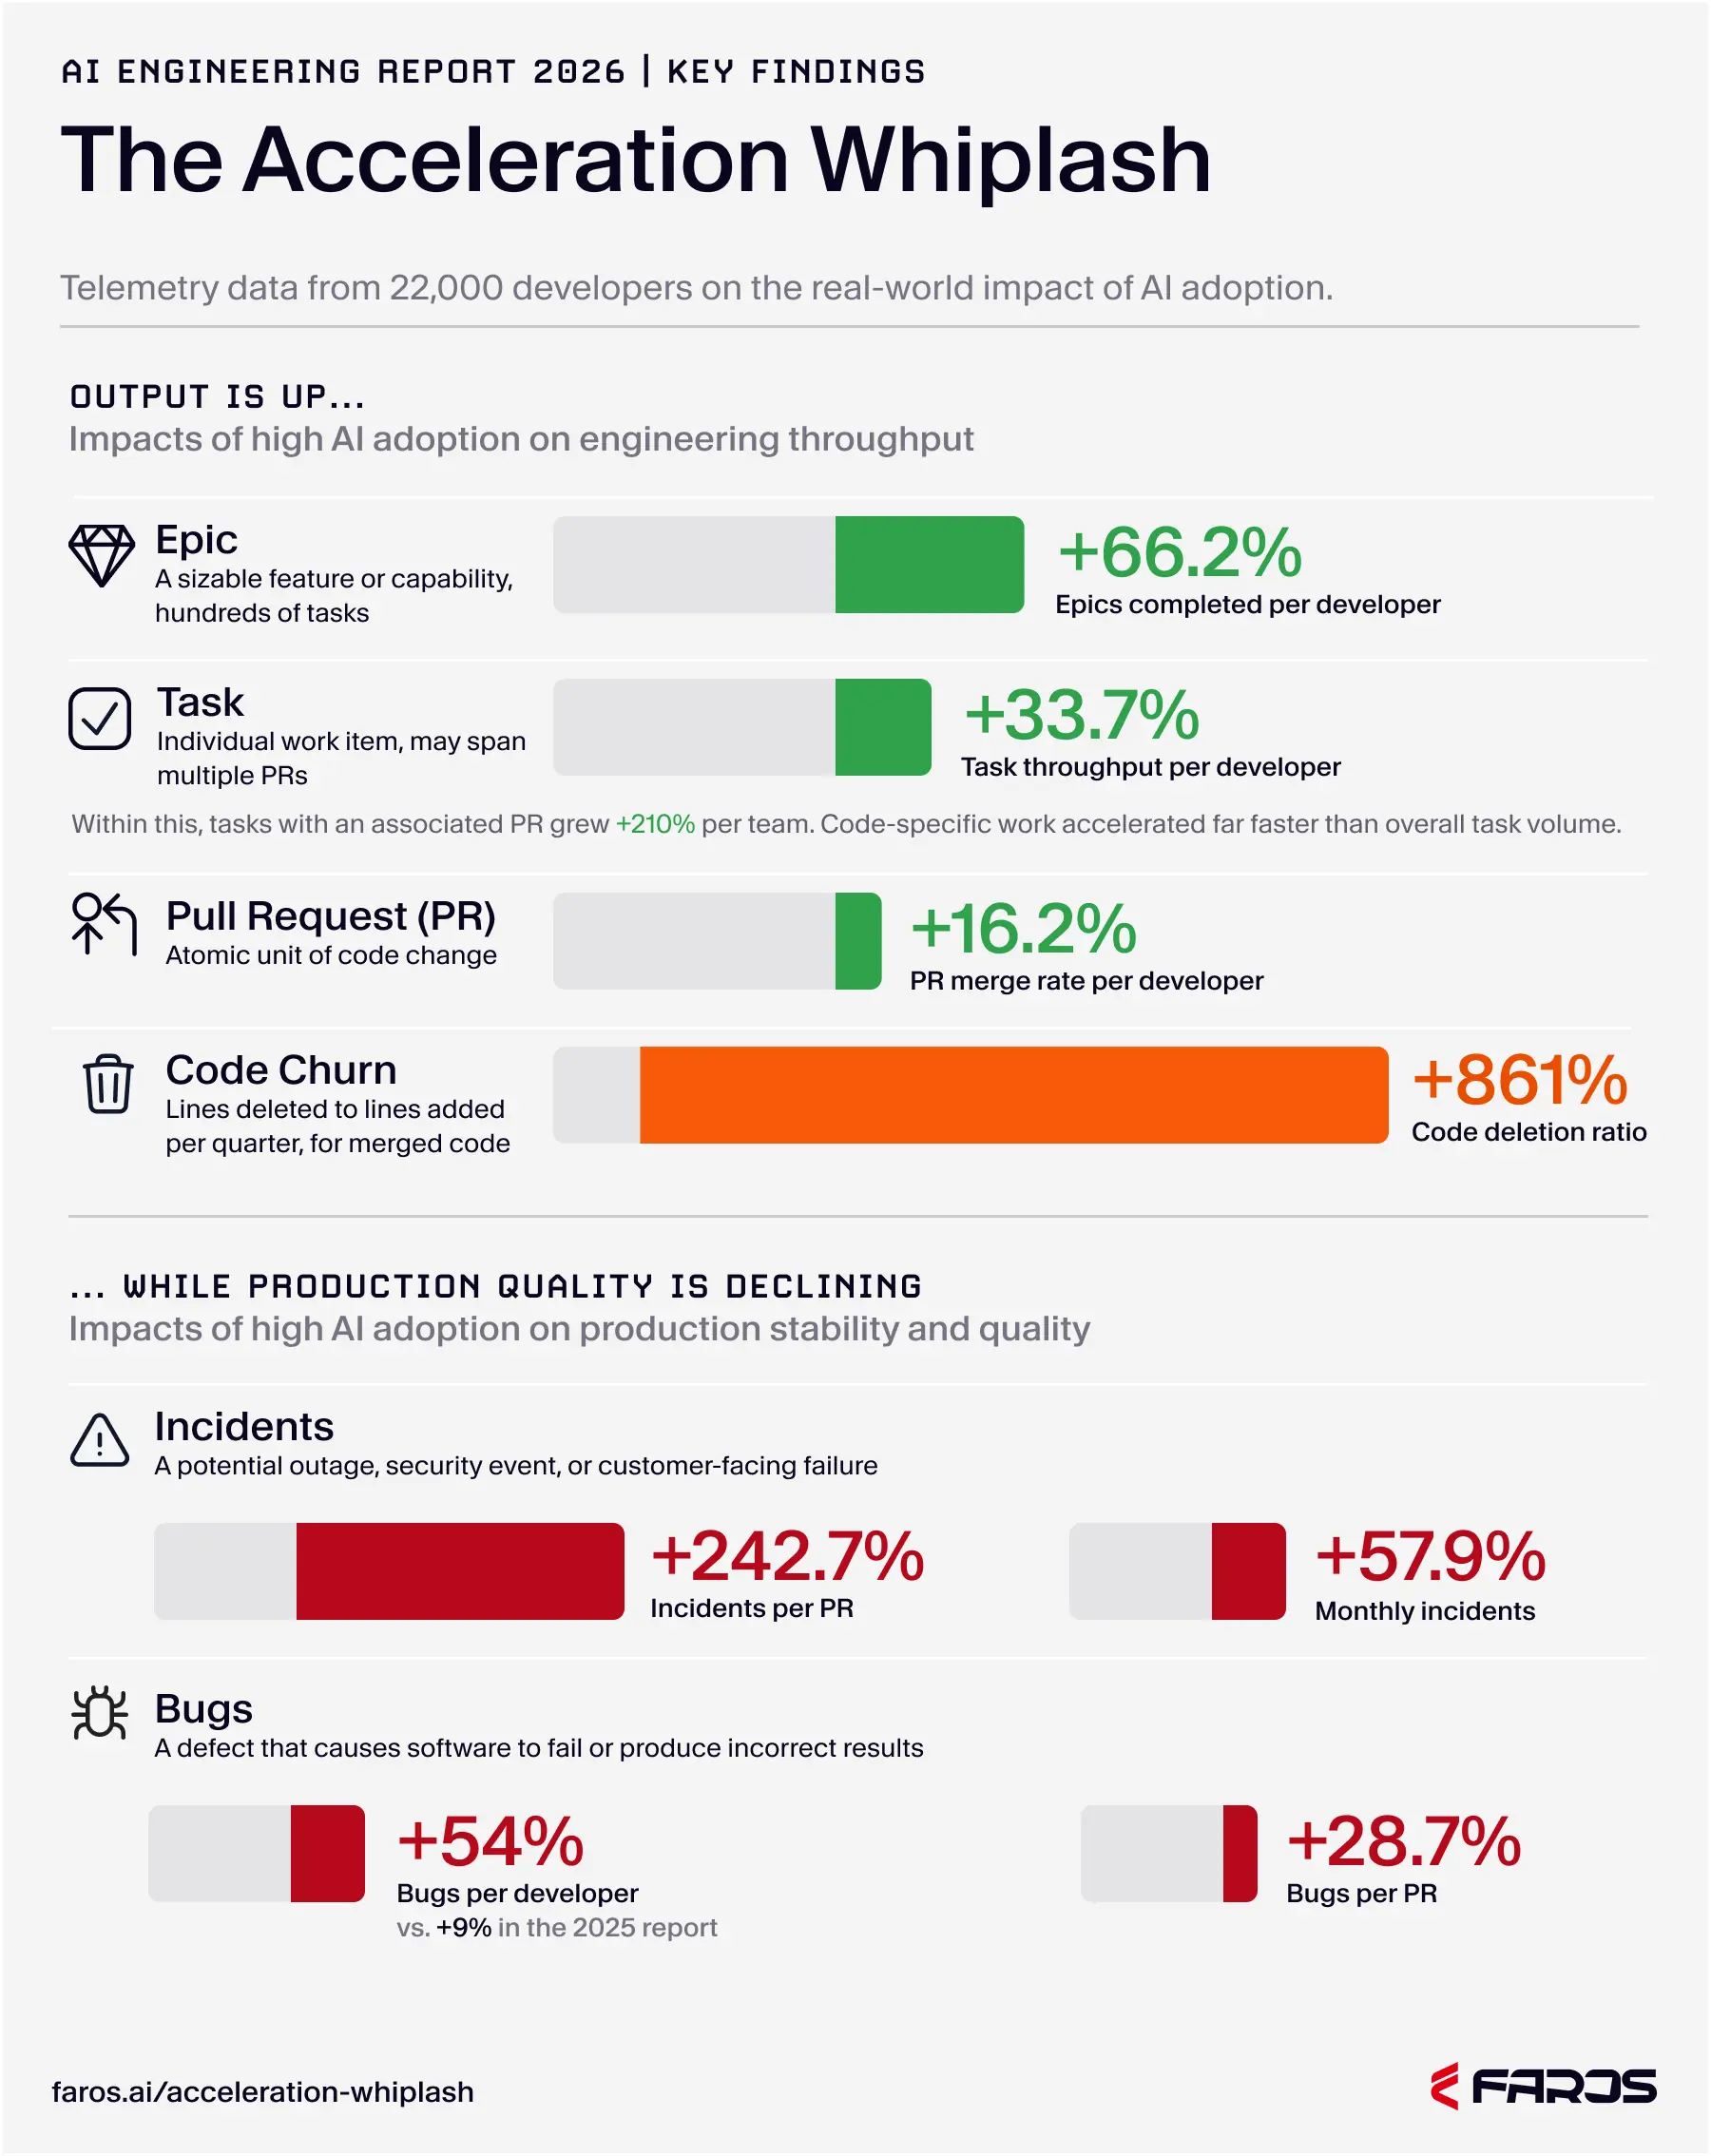
The report reveals that AI is now the primary author of code in most organizations studied, with 80% of teams exceeding the 50% weekly active user threshold for AI tools and AI-generated code acceptance rates rising from 20% to 60%. While business value is real (epics per developer up 66%, task throughput up 33.7%, PR merge rate up 16.2%), negative downstream effects include an 861% increase in code churn, a 242.7% rise in incidents-to-PR ratio, and a 54% increase in bugs per developer. The report highlights that increased throughput comes with higher risks, more rework, and greater burden on senior engineers. Note: These findings are based on telemetry from organizations using Faros and may not generalize to all environments.
Platform Capabilities & Features
What is the Faros platform and how does it help engineering organizations?
Faros is a model-agnostic control plane for AI engineering that optimizes workflows, reduces costs, and ensures compliance at scale. It integrates with over 60 engineering data sources, builds a live model of engineering systems, and provides features such as the Engineering World Model, Time Machine (for evidence-backed evaluation), and a Policy Engine for governance. Faros traces every AI dollar to shipped outcomes, enabling leaders to measure ROI, optimize spend, and enforce compliance policies. Note: Faros is best suited for organizations seeking unified observability, optimization, and governance across engineering teams; teams with highly custom or legacy workflows may require additional integration effort.
What are the main features of Faros relevant to AI engineering and developer productivity?
Key features include:
Engineering World Model: Integrates operational data and token flow into a live graph for real-time attribution.
Time Machine: Replays historical engineering work to validate model routes and workflow fixes before deployment.
Policy Engine: Manages policies, budgets, quotas, and routing rules with a full audit trail.
Token Intelligence: Tracks token spend and ties it to outcomes, identifying cost-effective models and workflows.
Integration with 60+ data sources: Connects to builder desktops, source control (GitHub, GitLab, Bitbucket), CI/CD, tickets, and incident management tools.
Note: Some advanced features may require additional configuration or integration depending on your environment.
How does Faros address the pain points highlighted in the Acceleration Whiplash report?
Faros addresses challenges such as exploding token bills, model route guesswork, uneven results, lack of AI ROI visibility, risk from ungoverned AI usage, and coordination challenges. For example, Faros's Time Machine feature validates model routes before deployment, reducing rework and incidents. Token Intelligence ties spend to outcomes, helping control costs. The Policy Engine enforces governance and provides an audit trail. Case studies (e.g., Autodesk, Coursera, SmartBear) show measurable improvements in productivity, compliance, and resource allocation. Note: Effectiveness depends on proper integration and adoption; detailed limitations not publicly documented—ask sales for specifics.
Business Impact & Use Cases
What tangible business impact can organizations expect from using Faros?
Organizations using Faros have reported cost optimization (e.g., 50% reduction in cost per task in internal studies), improved engineering velocity, enhanced ROI visibility, and risk mitigation through automated policy enforcement. Case studies include Autodesk (understanding productivity changes), Coursera (tracking engineering vision and metrics), and SmartBear (resource usage and compliance audit trail). Note: Results may vary based on organization size, integration depth, and adoption; detailed limitations not publicly documented—ask sales for specifics.
Who are typical users of Faros and what industries benefit most?
Faros is used by engineering leaders, compliance stakeholders, and resource-constrained teams in organizations with significant AI and software engineering investments. Industries represented in case studies include software development (Autodesk), online education (Coursera), and software testing (SmartBear). Faros is particularly valuable for compliance-heavy industries and enterprises requiring integration with multiple engineering data sources. Note: Smaller organizations or those with minimal AI adoption may not realize the full value of the platform.
Implementation & Integration
How long does it take to implement Faros and what is the onboarding process like?
Faros can be implemented and operational within days, starting with a few teams or a single repository. The platform integrates with existing workflows without requiring process changes. Onboarding assistance is provided, and customer data remains secure during setup. Note: Integration with highly customized or legacy systems may require additional effort; detailed limitations not publicly documented—ask sales for specifics.
What integrations does Faros support?
Faros connects to over 60 engineering data sources, including builder desktops and agents, gateways, source control (GitHub, GitLab, Bitbucket), tickets (Jira, Trello), CI/CD pipelines (Jenkins, CircleCI, Travis CI), and incident management platforms (PagerDuty, Opsgenie). Note: Some integrations may require additional configuration or support; detailed limitations not publicly documented—ask sales for specifics.
Pricing & Plans
What is Faros's pricing model?
Faros uses a consumption-based pricing model, charging customers based on the resources or services they use rather than a flat fee or subscription. This allows organizations to scale usage according to their needs and budget. Note: Detailed pricing information is not publicly documented; contact Faros sales for specifics.
Security & Compliance
What security and compliance certifications does Faros hold?
Faros is compliant with SOC 2, ISO 27001, GDPR, and CSA STAR standards. The platform includes enterprise-grade security features such as granular access control, secure deployment options (SaaS, hybrid, on-premises), and customizable security policies (MFA, password history, session timeout, IP restrictions). For more details, visit the Faros Trust Center. Note: Some certifications may be in progress or subject to periodic renewal; verify current status with Faros.
Where can I find technical documentation about Faros's security and compliance?
Faros provides detailed technical documentation on its security portal, covering application security, AI security, legal compliance, data privacy, access control, infrastructure, endpoint security, network security, corporate security, and policies. Note: Some documentation may require authentication or a customer relationship to access.
Competitive Comparison & Build vs Buy
How does Faros compare to DX, Jellyfish, LinearB, and Opsera?
Faros differs from DX, Jellyfish, LinearB, and Opsera in several ways:
First to market with AI impact analysis (October 2023) and publishes landmark research (22,000 developers, 4,000 teams).
Uses ML and causal methods for accurate AI impact measurement; competitors provide only surface-level correlations.
Offers active adoption support, actionable insights, and end-to-end tracking (velocity, quality, security, satisfaction, business metrics).
Enterprise-ready with SOC 2, ISO 27001, GDPR, and CSA STAR compliance; available on major cloud marketplaces.
Highly customizable and integrates with the full SDLC, not just Jira/GitHub.
Competitors like Opsera are SMB-focused and lack enterprise readiness; DX, Jellyfish, and LinearB have limited tool support and less accurate metrics. Note: Faros may require more integration effort for highly custom environments; detailed limitations not publicly documented—ask sales for specifics.
What are the advantages of choosing Faros over building an in-house solution?
Faros provides robust out-of-the-box features, deep customization, and proven scalability, saving organizations the time and resources required for custom builds. Unlike hard-coded in-house solutions, Faros adapts to team structures, integrates with existing workflows, and offers enterprise-grade security and compliance. Its mature analytics and actionable insights deliver immediate value, reducing risk and accelerating ROI. Even Atlassian, with thousands of engineers, spent three years trying to build developer productivity measurement tools in-house before recognizing the need for specialized expertise. Note: Organizations with highly unique requirements may still need custom extensions; detailed limitations not publicly documented—ask sales for specifics.
Customer Proof & Success Stories
Can you share specific case studies or success stories of customers using Faros?
Yes.
Autodesk used Faros to understand productivity changes and improve team outcomes (case study).
Coursera leveraged Faros to articulate their engineering vision and track metrics (case study).
SmartBear used Faros to ensure effective resource usage and provide a compliance audit trail (case study).
These examples demonstrate measurable improvements in productivity, compliance, and resource allocation. Note: Outcomes depend on organization context and adoption; detailed limitations not publicly documented—ask sales for specifics.
Ten takeaways from the AI Engineering Report 2026: The Acceleration Whiplash
What two years of telemetry data from 22,000 developers reveals about AI's real impact on developer productivity, code quality, and business risk in 2026.
Ten takeaways from the AI Engineering Report 2026: The Acceleration Whiplash
What two years of telemetry data from 22,000 developers reveals about AI's real impact on developer productivity, code quality, and business risk in 2026.
Ten takeaways from the Acceleration Whiplash report
Two years of telemetry. 22,000 developers. More than 4,000 teams.
The AI Engineering Report 2026 is not a survey of how developers feel about AI. It is a measurement of what AI is actually producing across the full software development lifecycle, tracking metric change between periods of lowest and highest AI adoption within each organization.
What it found has a name: the Acceleration Whiplash. AI has flooded a system built around human-paced development and human-quality code with output it was never designed to absorb.
Throughput is up. So are bugs, incidents, and the hidden costs accumulating at every stage downstream.
This report examines seven areas where that tension is visible: adoption, throughput, context switching, code complexity, pre-merge quality, workflow efficiency, and production quality. Here are ten takeaways from the data.
{{cta}}
1. AI crossed a threshold. It is now the primary author of code.
This did not happen as a deliberate decision by most organizations. It happened as AI tool adoption scaled, acceptance rates climbed, and agent-mode tools began applying changes directly rather than waiting for a developer to approve each suggestion. In the organizations we studied, 80% of teams now exceed the 50% weekly active user threshold for AI tools. The acceptance rate of AI-generated code has risen from 20% to 60%. AI is not assisting developers. In most organizations, it is leading them.
2. The business value is real. Roadmaps are finally moving.
The 2026 AI engineering impact data is not all bad news, and it is important to say that clearly. Epics completed per developer are up 66%. Task throughput per developer is up 33.7%. PR merge rate per developer is up 16.2%. These numbers represent real delivery acceleration: more features shipped, more initiatives completed, more code entering the codebase than at any prior point in our dataset. AI productivity gains at the business level are real, and engineering leaders are right to want more of them.
3. But the throughput numbers have an asterisk.
Code churn, the ratio of lines deleted to lines added for merged code in a given quarter, has increased 861% under high AI adoption. At nearly 10 times the prior rate, significantly more code is being removed relative to what is being added. There are several plausible explanations: developers accepting AI-generated code quickly and returning to replace it when it proves insufficient in practice, AI enabling teams to finally tackle large-scale refactoring that was previously too slow or costly to staff, or engineers simply moving faster to improve code they were never fully satisfied with at the time of shipping.
All three are consistent with the data, and the right explanation likely varies by organization. Every organization should determine which one applies to them. With access to Git-level line provenance data, you can determine whether deleted lines were written recently, suggesting rework of AI-generated code, or whether they represent legacy code being productively refactored. Either way, a significant increase in this ratio warrants investigation. Throughput measures what was shipped, not what survived. The 861% is the asterisk on every output number in this report.
4. For every code change merged, the probability of a production incident has more than tripled.
The incidents-to-PR ratio is up 242.7% as teams move from low to high AI adoption. An incident is an outage, security event, or system failure reaching real users in production systems across finance, healthcare, infrastructure, and every other sector where software runs critical operations. For every PR merged, incidents are occurring at more than three times the rate relative to the low AI adoption baseline. This is a ratio, not a probability: a single PR can be linked to multiple incidents, and not every incident traces directly to the most recent merge. The figure establishes that the relationship between merged code and production failures has deteriorated dramatically as AI adoption has scaled. Monthly incidents are up 57.9%. What started as a productivity conversation has become a reliability problem.
{{cta}}
5. Bugs are accelerating, not stabilizing.
In our 2025 AI engineering report on the AI Productivity Paradox, bugs per developer were up 9% as AI adoption grew. In this dataset, that figure has risen to 54%. The relationship between AI adoption and defect rate is not flattening as organizations mature their AI programs; it’s steepening. More AI-generated code in the codebase correlates with more bugs per developer, and that relationship is strengthening as adoption deepens.
6. AI made it easy to start work. It did not make it easy to finish it.
Daily PR contexts per developer are up 67.4%. Work restarts, tasks that return to in-progress after moving to another stage, are up 13.8%. 26% more in-progress tasks show no activity for seven or more days: work that was started, claimed capacity, and then stalled. The developer productivity picture that AI tools present at the individual level is one of acceleration. The workflow data tells a more complicated story: more threads opened, more work abandoned mid-flight, and a development environment where beginning is easy and finishing is hard.
7. The most experienced people in your organization are being buried. We call it the senior engineer tax.
AI-generated code presents a specific and under-appreciated challenge for reviewers. It is often superficially convincing: idiomatic, well-named, stylistically consistent with the surrounding codebase. It looks like code written by someone who knows what they are doing. The structural and logical failures, when they exist, are beneath the surface. Catching them requires a reviewer to read carefully, reason about intent, and reconstruct the problem the code was meant to solve, rather than scanning for obvious errors. That is slow, expensive cognitive work, and the data reflects it. Median time to first PR review is up 156.6%. Average time spent in code review is up 199.6%. Median time in review is up 441.5%. The engineers with the deepest knowledge of the system are spending their most valuable hours unraveling plausible-looking code that should never have reached them in the state it did.
8. More code is entering production with no review at all.
Pull requests merged without any review, human or agentic, are up 31.3%. We do not believe this reflects a deliberate decision to bypass oversight. The more likely explanation is that reviewers cannot keep pace with the volume of AI-generated code arriving for their attention. The result is that code is reaching production systems with no oversight at a meaningfully higher rate than before high AI adoption. This finding, combined with the production incident data, defines the core risk of the acceleration whiplash.
9. Strong engineering foundations do not protect you. Two years of telemetry says so.
DORA's 2025 State of AI-Assisted Software Development report concludes, based on survey data, that strong engineering foundations amplify AI's benefits and offer protection against its downsides. Two years of telemetry data across thousands of teams tells a different story. High-performing engineering organizations, those with mature DevOps practices, high DORA metrics scores, and disciplined delivery processes, are experiencing the same downstream deterioration as everyone else. Surveys capture how developers feel about their work. Right now, developers feel more productive because, at the individual level, they are. What surveys cannot capture is what happens downstream: the review queues backing up, the incidents accumulating, the bugs reaching customers that never should have passed review. Perception lags reality. Telemetry does not.
10. Every organization cutting engineering headcount on the basis of AI output gains should read this report.
The AI engineering impact data shows that output is up. It also shows that the work required to ensure that output is safe, correct, and maintainable has not decreased. It has increased substantially. The engineers being considered for cuts are in many cases the ones absorbing the quality gap AI is creating. What does the data actually imply for headcount decisions, for the engineers entering the workforce, and for the organizations betting their delivery capacity on AI output alone? The report has a direct answer. We will let it speak for itself.
{{whiplash}}
The organizations that can see this clearly are already ahead.
The findings in this report are not visible to most engineering organizations. They require granular, adaptable metrics drawn from the systems where work actually happens: version control, CI/CD pipelines, incident management, work management, and IDE telemetry. Not the dashboards that organizations have been looking at for years, but metrics that can be sliced, correlated, and interrogated as AI changes what engineering teams produce and how they produce it.
The organizations represented in this dataset already have that visibility. They can see where throughput is real and where it is hollow. They can see where review is failing, where incidents are clustering, and where senior engineer time is being consumed. That visibility is not a small advantage. It is the prerequisite for everything that comes next: the control, the guardrails, and the ability to push quality back to where it belongs, at the point of authorship, before the code ever reaches review.
Token Intelligence is where that visibility starts for AI spend specifically — every token classified, every dollar attributed, every tool evaluated on what it actually produced.
The gap between knowing and acting is the only gap that matters now.
The AI Engineering Impact Report 2026: The Acceleration Whiplash draws on two years of telemetry data from 22,000 developers and more than 4,000 teams across the Faros platform, tracking metric change between each organization's periods of lowest and highest AI adoption. Download the full report.
Faros Research
Faros Research studies how engineering teams build, deliver, and improve. From annual reports to customer insights, our analysis helps enterprises understand what's working (and what's not) in AI-native software engineering.
Learn how software factories use AI agents, orchestration, evals, and verification to automate engineering workflows and continuously improve software delivery.
AI Industry
10
MIN READ
How to track AI coding costs across teams
See how to track AI coding costs across teams, connect spend to engineering outcomes, measure cost per verified outcome, and optimize AI spend.
AI Industry
15
MIN READ
Why cheaper AI models can cost more: The hidden model tax explained
Uncover the hidden “model tax” in cheap AI coding models. Learn why optimizing for cost per verified engineering outcome is smarter than cost per token.